Chandrayaan-1
Long Term Archive Release
Chandrayaan-1,
the maiden Indian mission to Moon was launched during October-2008. The main
objective of the mission is the photo-selenological and chemical mapping of the
Moon. It carried 11 instruments onboard including SAC developed Terrain Mapping
Camera (TMC) & Hyper Spectral Imager (HySI). TMC is the prime imaging
payload to collect stereoscopic data of lunar surface. It has 5m spatial
resolution and 20 km swath operating in panchromatic band (500-880 nm), is an
optical imaging payload comprising three cameras with different view angles
viz., fore, aft and nadir, accomplished through the use of suitably displaced
linear arrays in the focal plane of a single lens. The Hyper Spectral Imager
(HySI), operating in the visible and near Infrared spectral region, is one of
the three imaging instruments onboard Chandrayaan-1 spacecraft for
mineralogical study of the Moon. HySI is designed to map entire lunar surface
in 64 contiguous bands in the visible and near infrared (VNIR: 421-964 nm) with
a spatial sampling of 80m. A wedge filter is employed for the spectral
separation and the image is mapped on an area detector.
1.
Chandrayaan-1 Long Term Archive (LTA)
(http://www.issdc.gov.in/)
The data
acquired at various phases of the Chandrayaan-1 mission from TMC, HySI, M3,
SARA and MiniSAR are processed as per the processing level definitions and provided
with Planetary Data System (PDS) standards for archival. The instrument data in
PDS has gone through a peer review process (as per the standard guidelines of
PDS) by the expert reviewers from various global archive agencies and a Long
Term Archive (LTA) is prepared for TMC, HySI and SARA. The peer review for M3
and MiniSAR has been carried out by their respective agencies and the data has
been submitted to Indian Science Data Archive (ISDA) at ISSDC. ISDA holds the
science data for all the Indian science missions, and is responsible for data
archival and dissemination.
The LTA can be
accessed from the current site http://www.issdc.gov.in/. This site has the facility to browse
through the available datasets of TMC, HYSI, MIniSAR, M3 and SARA and download
the required data. TMC, HySI and SARA datasets can be downloaded on the request
basis currently. Users can view M3 and MiniSAR and download the full data
archives from the http://ode.rsl.wustl.edu/moon/indexDataSets.aspx. The
PDS data once downloaded can be viewed by the PDS viewers available from ISSDC
or by any other standard viewers. User needs to register once to browse and to
get access to the data. The procedure is self explanatory for browse and data
access, when the user goes to the site and logins in. A sample screen shot of
TMC browse is shown in Figure-1. Table-1 gives the instrument
wise data archive information of LTA in the current version.
Browse application provides a user interface
to the user which allows the user to search for the available TMC, HySI, HySI
Band to Band Registered (BBR) and Digital Elevation Model (DEM) on the basis
of date of pass, orbit_number and latitude/ longitude. The user can view the
Thumbnails (JPEG) of all the datasets along with metadata. It also showcases the
peer-reviewed SARA, M3 and MiniSAR datasets. The PDS data contains relevant
documentation in the Document directory. More information about the data can
be found out in these documents.
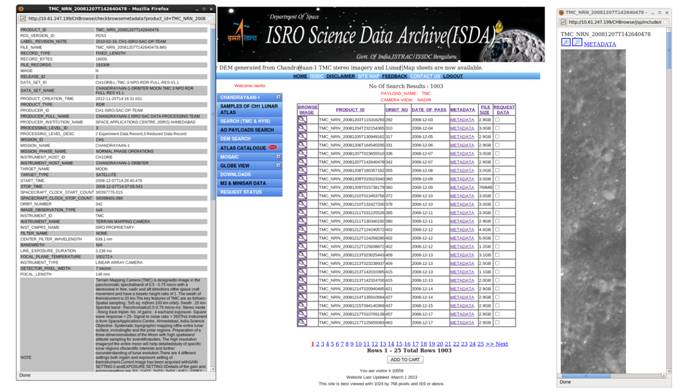
Figure-1:
Chandrayan-1 TMC Browse snapshot
The user can also visualize
the mosaics of the TMC, DEM and HySI North Pole and South Pole datasets as
shown in the Figure-2 as well as the Globe View as in Figure-3.
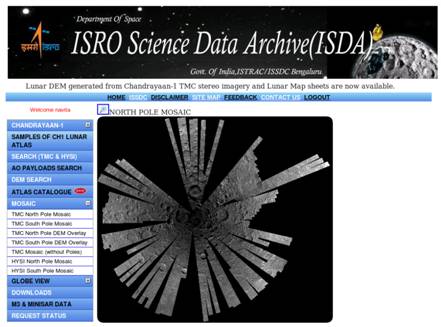
Figure-2:
Chandrayan-1 TMC North Pole Mosaic
The TMC and
HySI data sets are based on the latest version of SPICE generated for entire
mission (except for the period from 14th Nov. 2008 to 02nd Dec. 2008) of imaging. SARA browse datasets
are available for the full season.
Table-1:
Instruments wise Data Archive Information of LTA in the current version
|
S.No.
|
Instrument ID
|
Data Set Id
|
Total No. of Products Archived
|
Date Range
|
-
|
TMC
|
CH1ORB-L-TMC-2-NPO-EDR-RAW-DATA-V1.1
|
1003
|
2008-12-03
to 2009-08-17
|
|
|
|
CH1ORB-L-TMC-3-NPO-RDR-FULL-RES-V1.1
|
1003
|
-
|
HYSI
|
CH1ORB-L-HYSI-2-NPO-EDR-RAW-DATA-V1.1
|
772
|
2008-12-09 to 2009-08-17
|
|
|
|
CH1ORB-L-HYSI-3-NPO-RDR-FULL-RES-V1.1
|
772
|
|
|
|
CH1ORB-L-HYSI-4-NPO-REFDR-FULL-RES-V1.1
|
552
|
-
|
SARA
|
CH1ORB-L-SARA-2-NPO-EDR-CENA-V1.0
|
753
|
2008-12-08 to 2009-08-13
|
|
|
|
CH1ORB-L-SARA-2-NPO-EDR-SWIM-V1.0
|
699
|
-
|
MMM
|
http://ode.rsl.wustl.edu/moon/indexDataSets.aspx
|
-
|
MiniSAR
|

Figure-3:
Chandrayaan-1 TMC Globe View (as seen in the Web Site)
1.1
Chandrayaan-1 LTA Sample Images from TMC & HySI
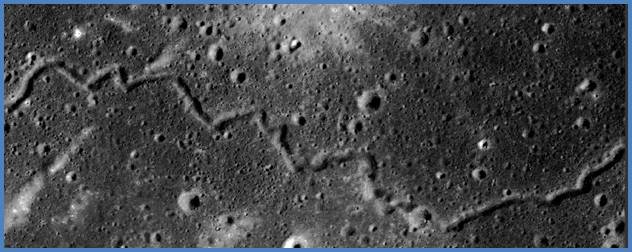
Figure-4: TMC -
Sinousrille

Figure-5: TMC - Small
Floor Crater
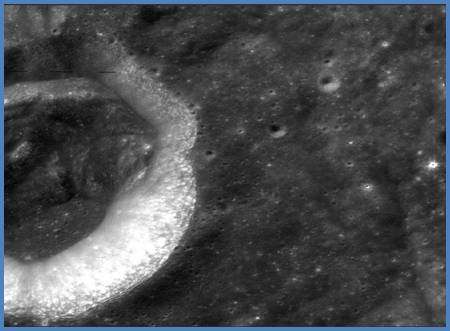
Figure-6: TMC -
Far Side Crater

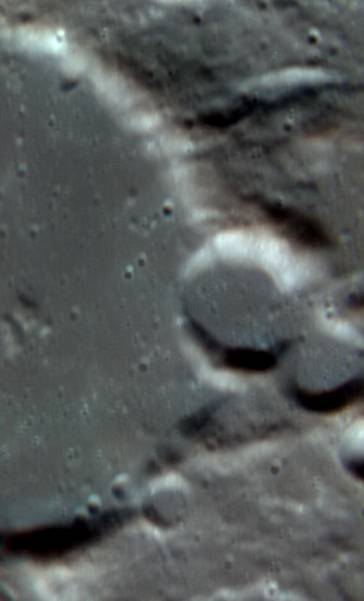
Figure-7: TMC -
Hale Complex Crater
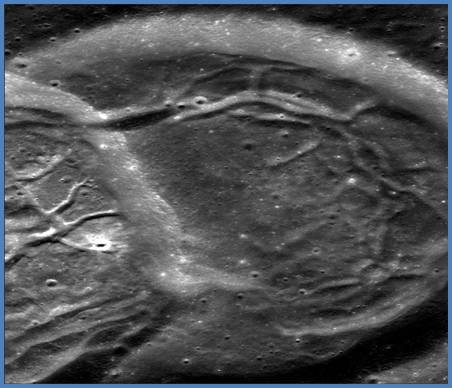
Figure-8: TMC - Overlapping Crater
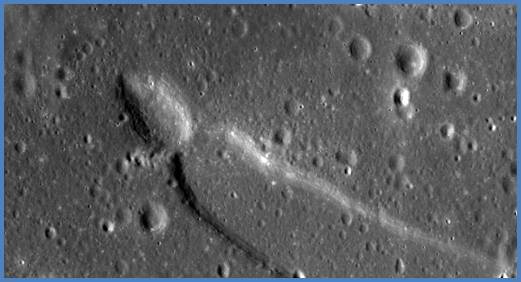
Figure-9: TMC - Interesting Moon Feature

Figure-10: TMC Moon Feature - Rille

Figure-11: TMC
Moon Feature Crater Rimaegassendi
Figure-12: HySI - Rille
Figure-13: HySI Crater
Rimaegassendi

Figure-14: HySI -
Fmaitre Crater (Color assignment -Bands 18 (B), 32 (G), 56 (R))
|
|
|
|
Figure-15:
HySI - Ring Crater (Color assignment -Bands 18 (B), 32 (G), 56 (R))

|
Figure-16:
HySI Small Floor Crater (Color assignment -Bands 18 (B), 32 (G), 56 (R))
|
1.2
Tools for Viewing Data Products in LTA
The
data products archived in LTA are as per PDS archive standard. All the data
sets are in PDS. Tools used for viewing data products are defined below.
Ch1 PDS Viewer
The
Ch1 PDS Viewer was java based software designed & developed in house. This
software is provided in LTA under software directory of TMC and HySI
instruments. The users can download and install at their end. The information on
installation steps and user manual are provided along with the software. The software
takes TMC & HySI PDS data sets as an input which mainly include data label
file and geometry label file and displays the image product along with geometry
information. Figure-17 below
shows the display of TMC instrument data from the software. The data is CODMAC
Level-3 i.e. Reduced Data Record (RDR).
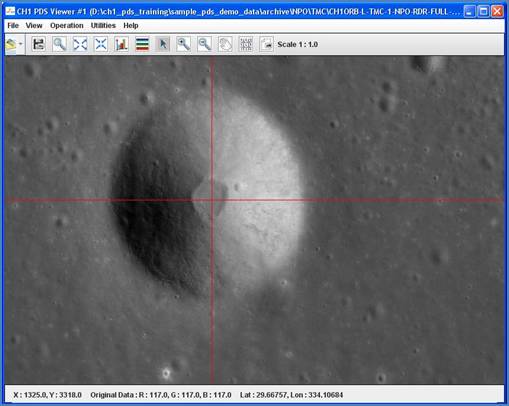
Figure-17: TMC Instrument data by Ch1PDSViewer
Figure- 18 given below shows the display of
HySI instrument data from the software. The data is CODMAC Level-3/4 data. The
HySI image data is composed of 64 bands stored in PDS as a spectral qube.

Figure-18: HySI Instrument data by Ch1PDSViewer
2. TMC
Digital Elevation Model & Ortho Images
The prime objective of TMC is to
provide the triplet imagery of the lunar surface towards lunar mapping. For
lunar mapping the basic inputs are Digital Elevation Models (DEM) to provide
elevation of the surface at a predefined intervals and orthoimages to represent
the surface features. The Digital Elevation Model (DEM) in this case is generated
using Nadir and Aft images of Terrain Mapping Camera (TMC). Ortho images are
generated using Nadir images and the DEM generated from Nadir and Aft images.
Lunar Digital
Elevation Models (DEM) are generated from possible passes of Chandrayaan-1 TMC stereo
imagery, having around 646 full pass DEMs using indigenous software called LDEM
version 3.0. Qualitative check (subjective) only has been carried out on all
the DEMs. With respect to some of the
available Lunar DEMs in the public domain, the planimetric accuracy may vary up
to 200 m and DEM height ranges may have some bias.
2.1
Characteristics of the DEM
PROJECTION
1.
Selenographic for equatorial region (in decimal degrees) with Latitude range
between +75 and -75 degrees having pixel scale at 0.000833degree
2. Polar
Stereographic for south and north pole regions (in meters) with Latitude range
beyond +75 to +90 degree North Pole and Latitude range beyond -75 to -90 degree
South Pole having pixel scale at 25meter
DATA VALUES USED
1. Latitude values would be from -90
to 90 degree
2. Longitude values would be from 0
to 360 degree
3. SemiMajorAxis = 1738000 m
4. SemiMinorAxis = 1735000 m
5. No Height Value = -20000
FILE FORMAT
1. The final DEM product is in TIFF
file format, conforming to TIFF 6.0 standard with 16 Bits/Sample
2. Sample Format: signed integer
(2bytes)
3. Compression Scheme: None
GENERAL INSTRUCTIONS
The No
height value/undefined height value in the DEM is -20000 and this
has to be ignored for display and processing purposes.
2.2
Characteristics of the Orthoimage
PROJECTION
1.
Selenographic for equatorial region (in decimal degrees) with Latitude range
between +75 and -75 degrees having Pixel Scale at 0.0001666degree
2.
Polar Stereographic for south and North Pole region (in meters) with Latitude
range beyond +75 to +90 degrees North
Pole and Latitude range beyond -75 to -90 degrees South Pole having Pixel Scale
at 5meter
DATA VALUES USED
1.
Latitude values would be from -90 to 90deg
2.
Longitude values would be from 0 to 360deg
3.
SemiMajorAxis = 1738000 m
4.
SemiMinorAxis = 1735000 m
FILE FORMAT
1. The
final ortho product is in TIFF file format, conforming to TIFF 6.0 standard
with 16 Bits/Sample
2. Sample
Format: unsigned integer (2bytes)
3. Compression
Scheme: PackBits
4. If
the ortho image size exceeds 4GB limit (before compression) then it is generated
in BigTIFF file format.
5. All
orthoimages are packBits compressed.
GENERAL INSTRUCTIONS
Wherever
DEM is having undefined height value of -20000, orthoimage will have zero(0) pixel value.
A
few sample gray scale images of DEM are given in Figure-19.
Figure-19:
Sample Digital Elevation Model of a TMC Image (dark to bright gray tone
represent the minimum to maximum height value of the respective DEM)
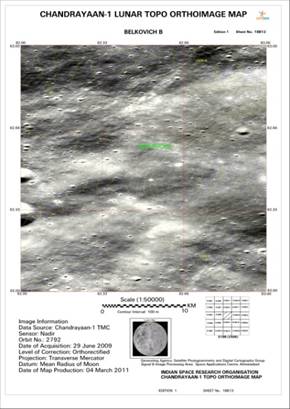
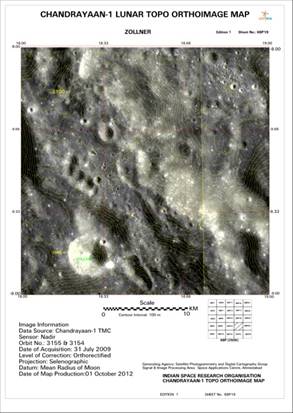
3. Lunar Atlas
The third data set is the release of some map sheets of Lunar Atlas
generated from Chandrayaan-1 TMC data.
Lunar Atlas comprises of lunar topographical maps which is a
collection of ortho-image, contours, annotation, grids and other mapping
features. Lunar Topographical maps have been generated at 1:50,000 mapping
scale with a contour interval of 100 m. The contours overlaid on the map are
extracted from the Digital Elevation Model (DEM) generated by Photogrammetric
restitution of Chandrayaan-1 TMC triplet. The maps show the names of prominent
features (mostly craters) present on the moon surface taken from IAU list.
These maps followed the mapping scheme and standards prepared by ISRO to
prepare global topographical maps of the moon at 1:50,000. The details of
Mapping Standards followed are:
1.
Projection
System: Selenographic projection for equatorial region (70 N to 70 S) and Polar
stereographic projection for North and South Pole regions (60N90N and
60S-90S). The Center latitude for Polar stereographic projections is 90 N and
90 S for north and south poles respectively. Moon mean radius datum has been
used for the mapping.
2.
Scale: The maps
published are of 1:50,000 scale. Exact map scale varies slightly according to
the latitude extent. The true scale is based on the centre of each 1:250,000
grid of map.
3.
Indexing
Scheme: The Indexing scheme used for this atlas is unique and derived first
time for entire moon at 1:250,000, 1:50,000 and 1:25,000 scales. The different
index maps are provided to user to locate the maps from 1:1 M to 1:25,000. This
Indexing scheme is the extension of Lunar Topographic Orthophoto Map Series (LTO)
of NASA. The indexing scheme and the naming convention of maps are shown in Figure-20(a) & 20(b)
respectively.
4.
Features: Each page
of this atlas consists of an overview of 1:50,000 / 1:25,000 annotated
topographic image map that depicts a particular region of the lunar surface. It
is not feasible to give a name of every crater on the moon. Each map consists
of at least one name of a crater and also identifies the satellite craters
associated with the main crater.
5.
File Format: The
Composed maps are provided in jpeg file format and can be opened in any jpeg
viewer.
. A few sample maps of the Lunar Atlas are given in Figure-21.
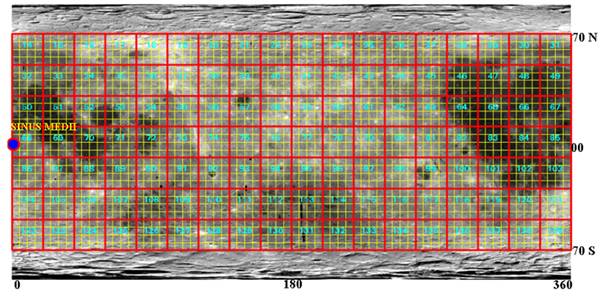
Figure-20 (a): Map Index of the Chandrayaan-1 mapping
(1:1 million Red & 250 K Yellow)
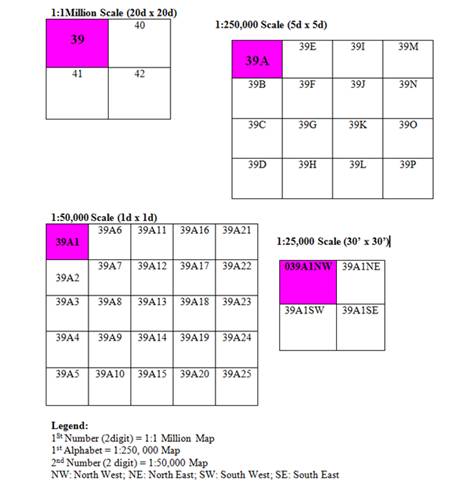
Figure-20 (b): Naming Convention for Chandrayaan-1
Maps at different scales